Archives: Projects
Projects
Rakuten Spotlight Employee
From Day 1 at Rakuten Advertising to now, my DevOps internship has been nothing short of transformative. I’ve had the chance to roll up my sleeves, contribute to real-world projects, and learn from an incredible team. Watch to hear what it’s like behind the scenes at Rakuten—and why this experience is fueling my growth every day.
Cloudflare DNS + Dockerized NGINX on AWS
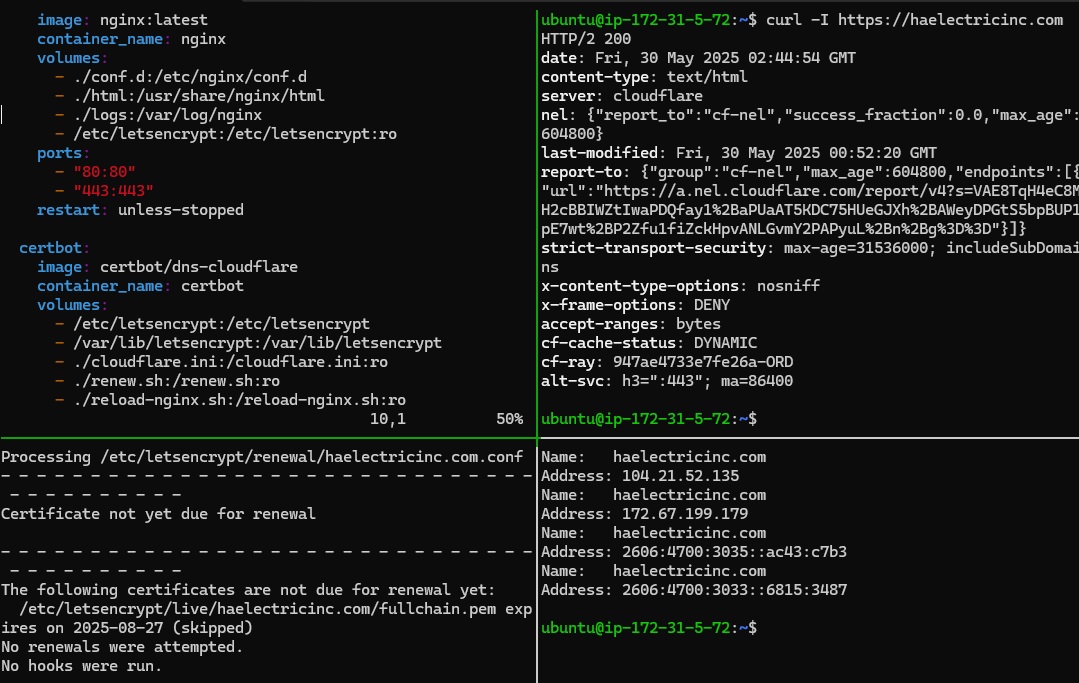
🌐 Cloudflare DNS + Dockerized NGINX on AWS
Launching a website isn't enough — it should be automated, secure, and built like infrastructure. This project uses Dockerized NGINX on an AWS EC2 instance, paired with Cloudflare DNS and an API-driven TLS workflow to serve https://haelectricinc.com reliably and securely.
🧰 What It Does
Serves a static business website using Docker and NGINX:
✅ Runs NGINX inside a Docker container
🌍 Uses Cloudflare DNS for global name resolution
🔒 Automates TLS with Certbot and Cloudflare API (DNS-01 challenge)
🔁 Auto-renews certificates and reloads NGINX with no downtime
📶 Hosted on AWS EC2 with firewall, health checks, and monitoring
⚙️ Requirements
-
AWS EC2 (Ubuntu)
-
Docker + Docker Compose
-
Cloudflare account and API token
-
Certbot Docker image with DNS plugin
-
NGINX container with mounted HTML/CSS
📫 Why It Matters
Static websites still deserve DevOps-grade deployment. This setup is:
✔️ Fully containerized and portable
✔️ TLS-secured using DNS automation — no ports needed
✔️ Designed for simplicity, uptime, and zero-touch renewals
✔️ Perfect for small business sites, portfolios, and DevOps learning labs
Fail2Ban Daily SSH Report Script
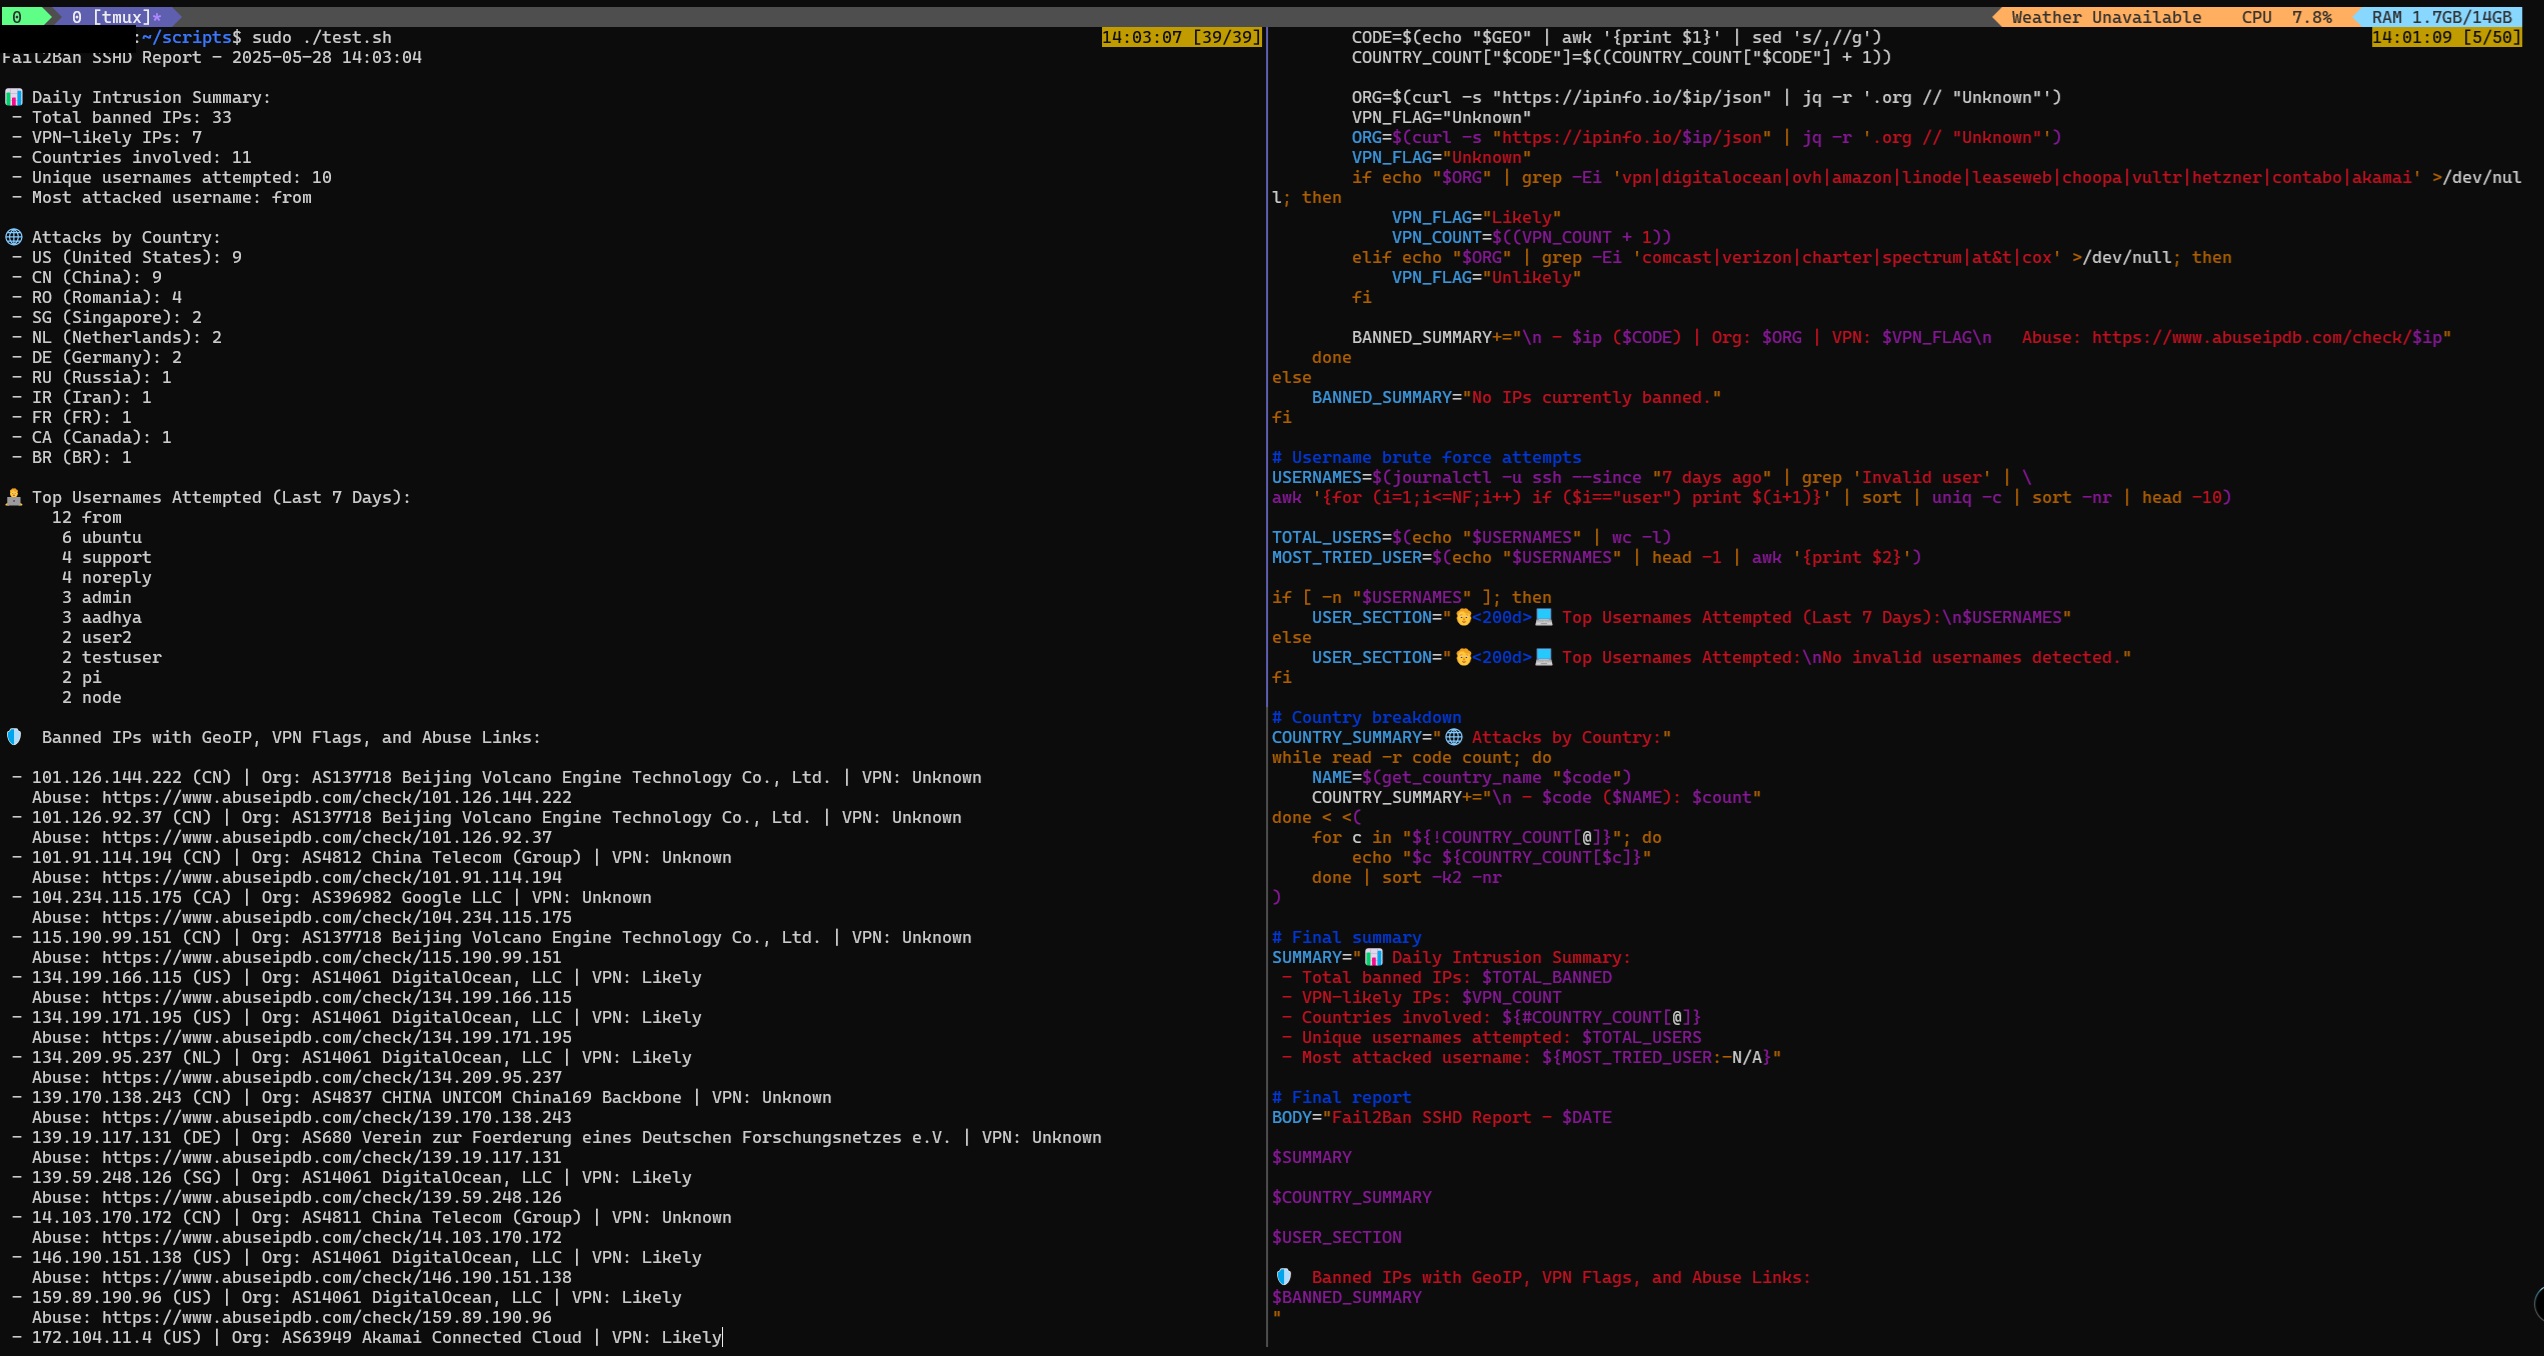
🔐 Fail2Ban Daily Report Script
Security isn’t just about blocking attacks — it’s about knowing they happened. This lightweight Bash script integrates with Fail2Ban to generate daily email reports on SSH intrusion attempts, giving you clear, actionable visibility without logging into the server.🧰 What It Does
- Pulls the list of IPs banned by the
sshdjail - Uses
geoiplookupto identify attacker locations - Formats a clean daily report:
- ✅ IP Address
- 🌍 Country of Origin
- 🕒 Timestamp
- Emails the report to a predefined address
⚙️ Requirements
fail2bangeoip-bin(forgeoiplookup)- CLI mail client (e.g.,
mutt,mailx, orssmtp) - Basic cron setup
📫 Why It Matters
Many sysadmins install Fail2Ban and forget it’s there. This script makes intrusion detection visible again — without manual log review. Perfect for: ✔️ Home lab monitoring ✔️ Lightweight VPS hardening ✔️ Situational awareness for SSH threats📎 Project Link
🔗 GitHub Repository: mikecozier/fail2banProxmox VM Provisioning Pipeline
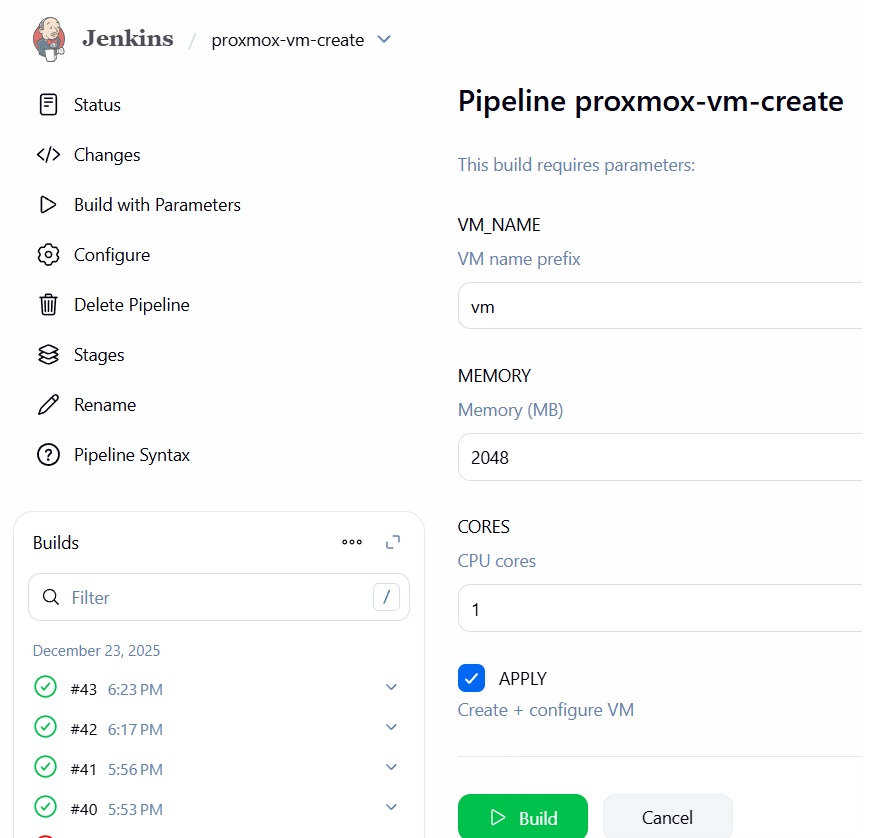
Proxmox VM Provisioning Pipeline with Jenkins (Infrastructure CI/CD)
I built an end-to-end infrastructure automation pipeline that provisions, secures, configures, and monitors virtual machines on Proxmox VE using modern DevOps tooling and real-world CI/CD patterns.
This project replaces a traditional “app-only” pipeline with full infrastructure lifecycle automation — from VM creation to secure access and observability — driven entirely by code.
Tech Stack
- Terraform - Infrastructure as Code for VM provisioning on Proxmox VE
- Jenkins - CI/CD orchestration and pipeline execution
- Ansible - Post-provisioning configuration management
- HashiCorp Vault - Short-lived SSH certificate authentication
- Prometheus = Automated monitoring and metrics collection
What the Pipeline Does
Jenkins Pipeline
- Triggers infrastructure builds on demand
- Accepts parameters such as VM name, CPU, and memory
- Orchestrates Terraform and Ansible stages
- Injects credentials securely using Jenkins Credentials
- Ensures no secrets are stored in Git
Terraform (Infrastructure as Code)
- Provisions virtual machines on Proxmox using API tokens
- Deploys from cloud-init enabled templates
- Configures CPU, memory, and networking
- Injects SSH access via cloud-init
- Uses least-privilege API credentials
- Marks sensitive values appropriately
Ansible Configuration
- Applies baseline OS configuration
- Installs Docker and Node Exporter
- Requests Vault-signed SSH certificates
- Configures SSH to use certificate-based authentication
- Ensures consistent and repeatable VM configuration
- Vault acts as an SSH CA
- Eliminates long-lived static SSH keys
- Issues short-lived certificates via AppRole
- Improves security and access auditing
- Designed for automated, ephemeral infrastructure
Prometheus Integration
- Automatically registers new VMs as scrape targets
- Uses file-based service discovery for clean updates
- Avoids manual Prometheus configuration changes
- Ensures new infrastructure is monitored immediately
Architecture Flow
Jenkins Pipeline → Terraform provisions VM via Proxmox API → VM boots via cloud-init → Ansible configures OS and services → Vault signs short-lived SSH certificates → Prometheus begins scraping metrics
Security Model
- No secrets committed to GitHub
- Jenkins Credentials manage sensitive values
- Terraform variables marked as sensitive
- Vault must already be unsealed or auto-unsealed
- SSH access uses short-lived certificates instead of keys
- .gitignore prevents state files and secrets from leaking
Why This Project Matters
This pipeline mirrors real-world infrastructure workflows used in production DevOps and platform engineering environments:
- Infrastructure treated as code
- CI/CD applied to servers, not just applications
- Secure, auditable access using certificate-based SSH
- Automated observability baked into provisioning
- Designed to scale across many VMs and environments
It demonstrates the transition from manual VM management to fully automated, repeatable infrastructure delivery.
Repository GitHub: https://github.com/mikecozier/proxmox-terraform-ansible-jenkins-create-vm
Docker Full-Stack
DevOps Monitoring and Reverse Proxy Stack (Docker + Traefik)
I built and published a production-style DevOps monitoring and reverse proxy stack using Docker Compose to demonstrate modern observability, security, and ingress patterns commonly used in real-world environments. This stack is designed to be secure by default, fully observable end-to-end, modular, and safe to share publicly with no secrets committed.
Core Stack Components
- Traefik serves as the central reverse proxy and ingress controller, providing automatic HTTPS using Cloudflare DNS-01 challenges.
- Pi-hole provides network-wide DNS filtering and visibility.
- Prometheus handles metrics collection across the host and containers.
- Grafana visualizes metrics and logs through dashboards.
- Loki and Promtail provide centralized log aggregation.
- NGINX serves a static website securely behind Traefik.
Key Highlights
- Centralized ingress with automatic HTTPS
- DNS-based certificate validation (no exposed port 80 challenges)
- Metrics and logs fully integrated into Grafana
- No services exposed directly to the internet
- Infrastructure-as-code using Docker Compose
- Public-safe configuration with runtime secrets excluded
Observability in Practice
- Prometheus scrapes host and container metrics
- Grafana dashboards provide visibility into CPU, memory, disk, network activity, and container resource usage.
- Promtail collects Docker and optional host logs, which are indexed by Loki and queried directly inside Grafana, enabling unified metrics and log correlation.
Security Approach
- HTTPS enforced everywhere
- Cloudflare DNS-01 ACME for certificates
- BasicAuth for administrative endpoints
- Security headers enabled (HSTS, XSS protection, no sniffing)
- Least-privilege exposure model
- No secrets stored in GitHub
Design Philosophy
This project intentionally mirrors real-world DevOps patterns rather than a one-off demo. It emphasizes modular services, centralized ingress, separation of metrics and logs, and configurations that are safe to publish while remaining extensible.
The stack is suitable for homelabs, learning environments, and as a foundation for larger infrastructure projects.Repository GitHub: https://github.com/mikecozier/docker-traefik-stack
- This repository uses example values only.
- Replace placeholders and review security settings before deploying in a production environment.
Unauthorized SSH Attempts Script
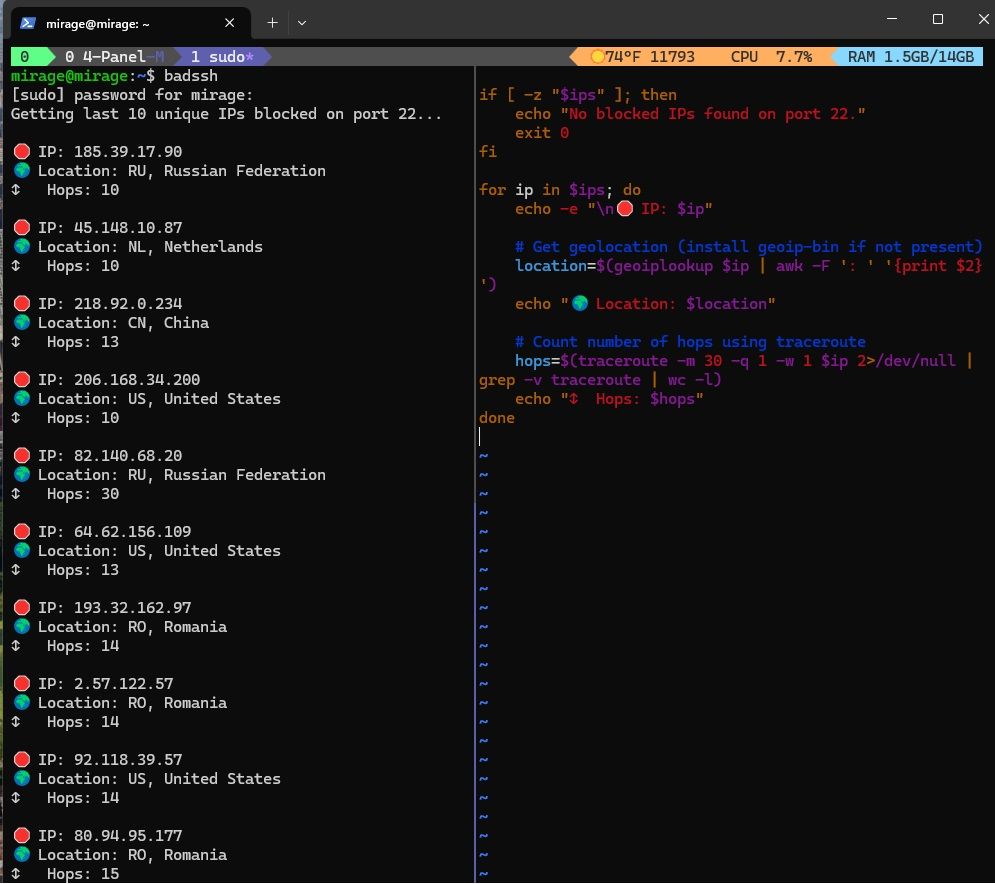
🔐 Tracking Unauthorized SSH Attempts with a Bash Script
Securing a Linux server isn’t just about firewalls — it’s about knowing who’s trying to break in. I wrote a lightweight Bash script called badssh.sh to track SSH intrusion attempts on port 22.
🧰 What It Does:
-
Scans UFW logs for blocked IPs
-
Displays the last 10 unique blocked IPs
-
Shows the timestamp, location, and network hops
-
Counts total blocked attempts for the day
⚙️ Setup:
-
Requires
ufw,geoiplookup, andtraceroute -
Enable UFW logging with
sudo ufw logging on -
Run manually or schedule with cron:
0 9 * * * /path/to/badssh.sh >> /var/log/ssh-monitor.log
🔗 GitHub: mikecozier/Bad-SSH-Attempts
Server Status Script
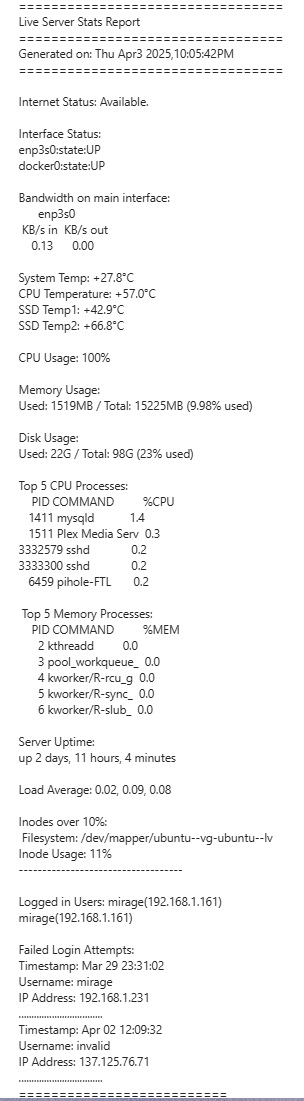
📬 Automating Linux Health Reports
To keep my home lab running smoothly, I built a simple Bash script called stats.sh that emails me daily server health reports. This way, I stay updated on performance and security without logging in manually.
🛠️ What It Does
-
Monitors system health: CPU, memory, disk usage, and temperatures
-
Tracks network status: connectivity, interface states, bandwidth
-
Detects security issues: failed SSH login attempts and inode usage
-
Sends a daily summary via email using
mutt
🚀 Why I Built It
I wanted a hands-free way to monitor my server’s health and spot issues early. With daily email reports, I can catch resource bottlenecks or suspicious login attempts before they escalate.
🔗 GitHub: mikecozier/Server-Stat-Script
Pi-hole with Docker and OpenDNS
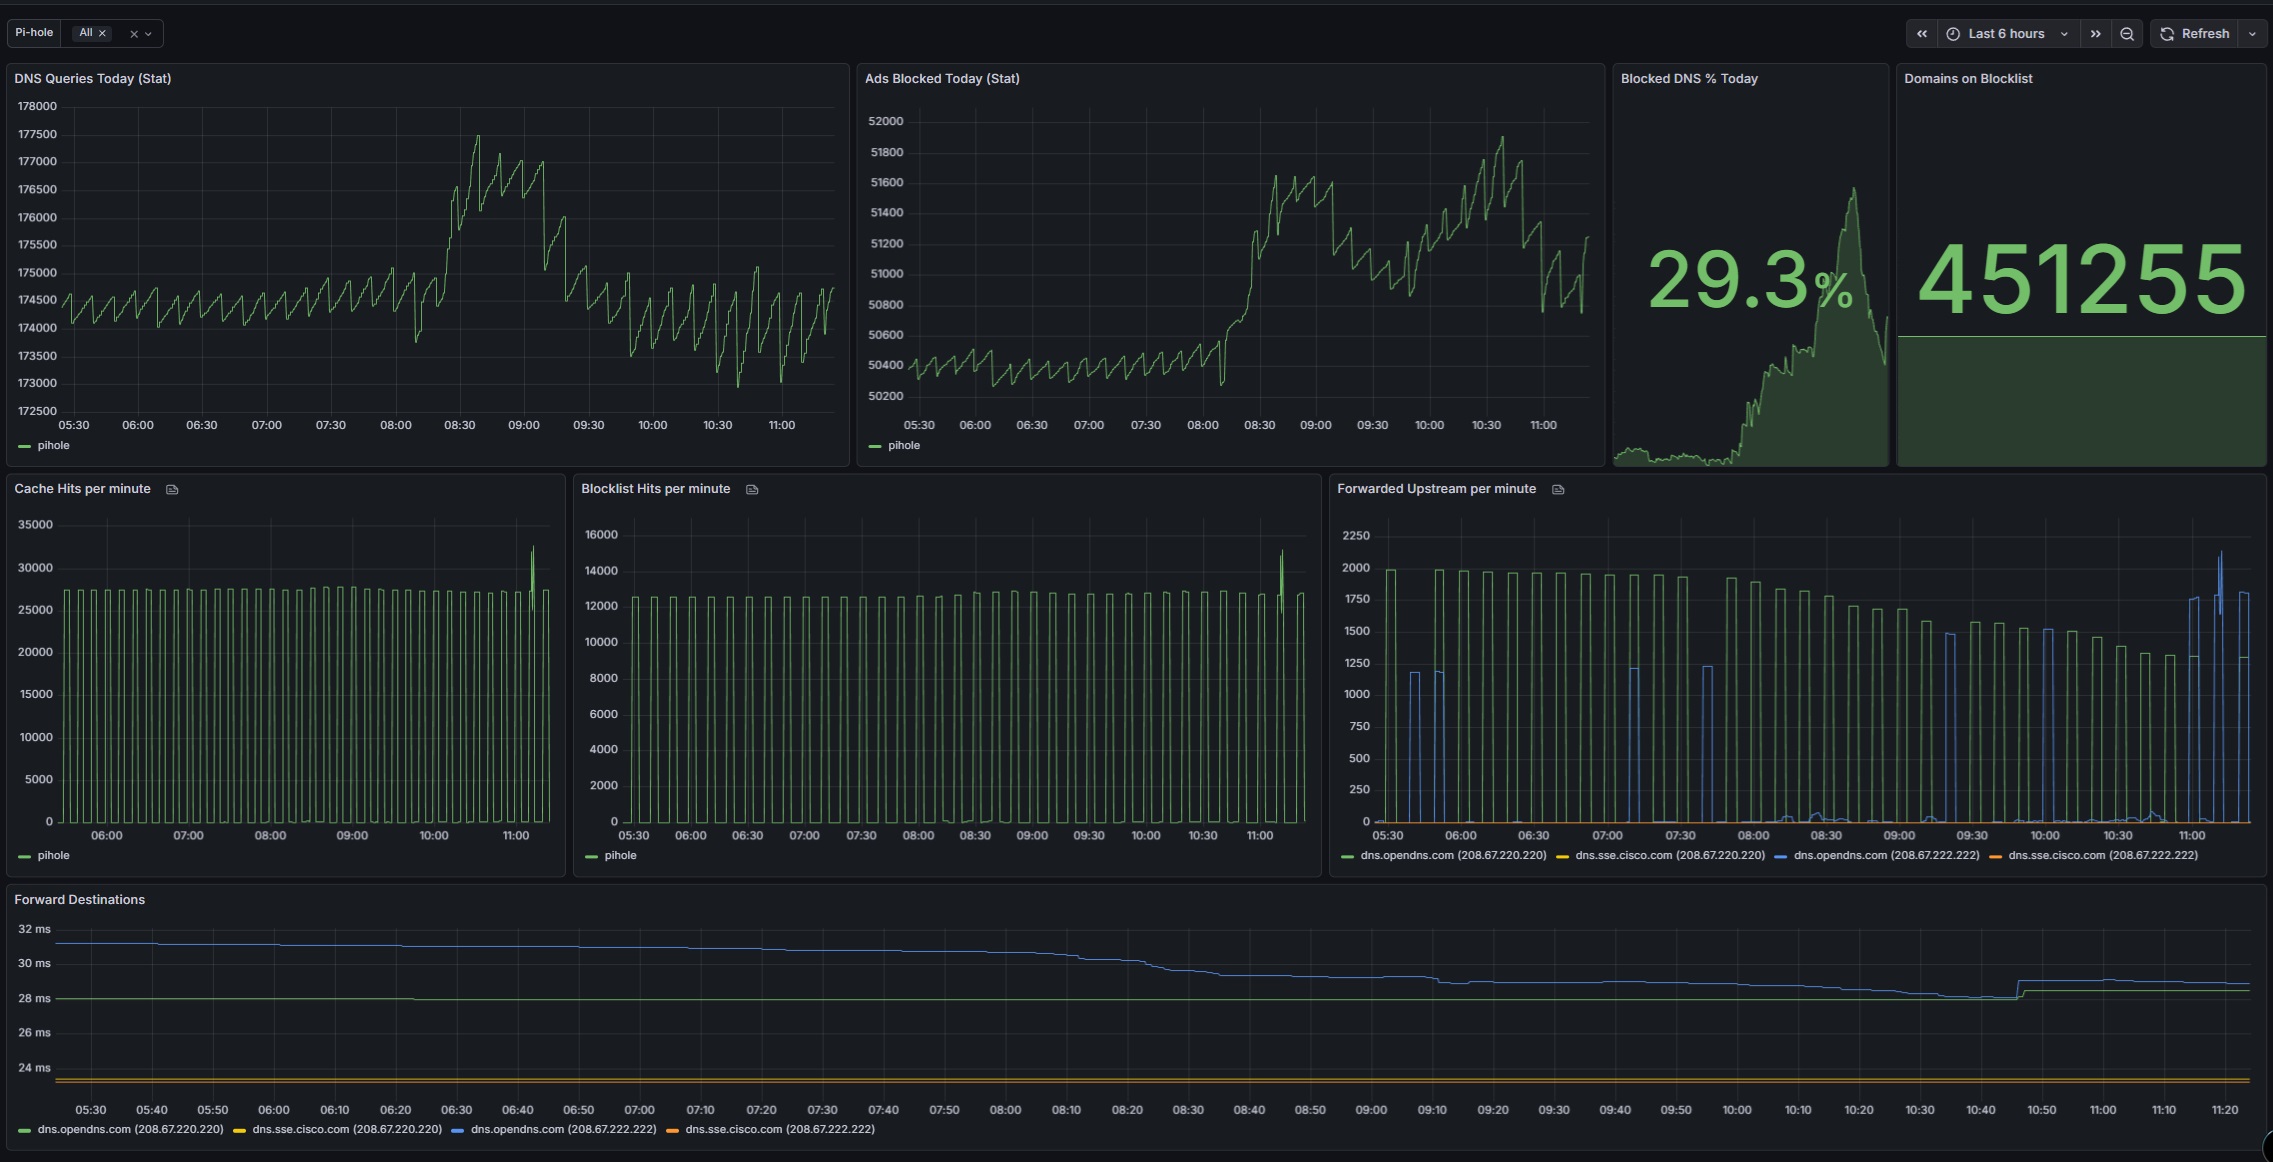
Pi-hole with Docker and OpenDNS (Network-Wide DNS, DHCP, and Monitoring)
I deployed Pi-hole in Docker as a centralized DNS and DHCP service, using OpenDNS as the upstream resolver to provide network-wide ad blocking, content filtering, and DNS-level security. The environment is fully monitored using Prometheus and Grafana, providing visibility into DNS activity, query volume, and blocked traffic across the network.
This setup treats DNS and DHCP as infrastructure services, deployed and observed using modern DevOps patterns suitable for homelabs and small office environments.
Why Docker Docker provides a clean, repeatable deployment model for Pi-hole.
- Portability across hosts and environments
- Isolation from the underlying operating system
- Simple updates and rollbacks via image versioning
- Consistent behavior across development and production setups
Why OpenDNS (Upstream DNS) OpenDNS is configured as Pi-hole’s upstream DNS provider, adding a security layer beyond local blocklists.
- Category-based content filtering
- Built-in phishing and malware protection
- Centralized policy management via the OpenDNS dashboard
- Defense-in-depth for DNS resolution
DHCP Architecture Pi-hole acts as the authoritative DHCP server for the network.
- Clients receive IP addresses, gateway, and DNS directly from Pi-hole
- DNS settings are enforced at lease time
- Eliminates reliance on consumer router DHCP services
- Ensures all devices use Pi-hole for DNS resolution
Monitoring and Observability with Grafana DNS activity is monitored using Prometheus and Grafana through a Pi-hole exporter. Metrics collected include:
- Total DNS queries
- Queries blocked by Pi-hole
- Percentage of traffic blocked
- Query types (A, AAAA, PTR, etc.)
- Top queried domains and clients
- Upstream DNS response performance
Key Benefits
- Network-wide ad blocking across all devices
- DNS-level phishing and malware protection
- Centralized DNS and DHCP control
- Real-time visibility into DNS usage and blocking behavior
- Historical trend analysis via Grafana dashboards
- Lightweight, containerized, and easily portable deployment
Use Case This configuration is ideal for homelabs and small office environments where DNS control, security, and observability are required. It demonstrates layered DNS security, centralized DHCP, and metrics-driven monitoring using Grafana.
Packet Tracer
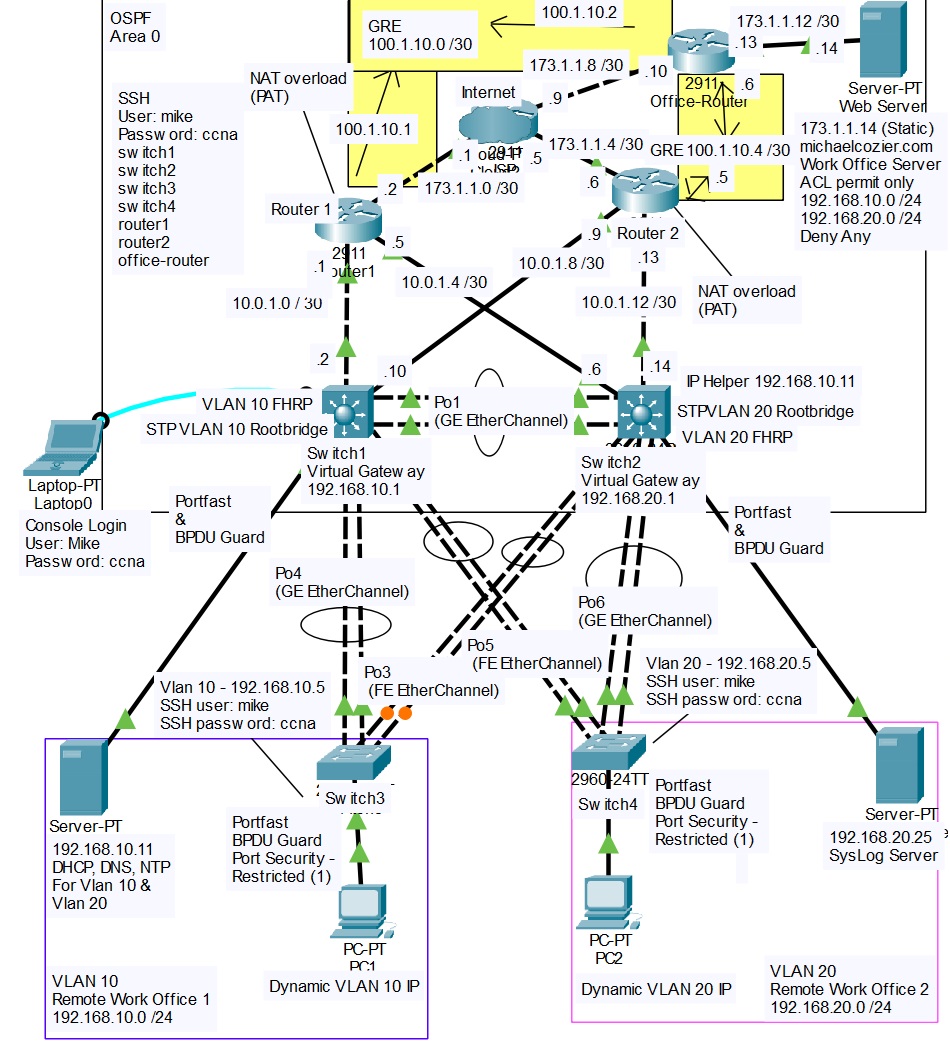
Building a Fully Redundant Multilayer Network in Cisco Packet Tracer
Overview :
In this project, I designed and implemented a high-availability enterprise network in Cisco Packet Tracer. The environment includes redundancy at every layer, dynamic routing, VLAN segmentation, First Hop Redundancy Protocols (FHRP), Access Control Lists (ACLs), DNS, GRE tunneling, centralized Syslog monitoring, and secure SSH-based management. The design mirrors a real-world enterprise multilayer architecture and demonstrates advanced switching, routing, and security concepts developed during my CCNA preparation.Network Topology and Features
- Two Cisco 3560 multilayer switches acting as the core/distribution layer
- Two Cisco 2960 switches at the access layer
- Two Cisco 2911 routers providing redundant WAN connectivity
- Office router simulating a remote site
- Redundant GRE tunnels between sites
- Internal DHCP and DNS server
- Centralized Syslog server
- External ISP cloud for Internet simulation
VLANs and Subnets VLAN 10 Subnet: 192.168.10.0/24 Purpose: Server and PC1 segment Default Gateway (HSRP): 192.168.10.1 STP Root and HSRP Active Device: MSW1 VLAN 20 Subnet: 192.168.20.0/24 Purpose: User and PC2 segment Default Gateway (HSRP): 192.168.20.1 STP Root and HSRP Active Device: MSW2
DHCP Relay Configuration Centralized IP address management is enabled using DHCP relay on the SVIs: interface vlan 20 ip helper-address 192.168.10.11 This allows all VLANs to receive DHCP services from a single server located in the server VLAN.
Dynamic Routing and GRE Tunneling OSPF Configuration • All VLANs, server networks, and management subnets are advertised in OSPF Area 0 • Both multilayer switches form adjacencies with both routers • Equal-cost multi-path (ECMP) routing provides load balancing and automatic failover GRE Tunnels To maintain site-to-site connectivity, redundant GRE tunnels were deployed: Tunnel 10 Router1 to Office Router (Primary) Tunnel 20 Router2 to Office Router (Backup) Both tunnels run OSPF to ensure dynamic routing and seamless failover. Example GRE configuration: interface Tunnel0 ip address 100.1.10.1 255.255.255.252 tunnel source gigabitEthernet0/0 tunnel destination 173.1.1.10 tunnel mode gre ip
Layer 2 Redundancy and FHRP Spanning Tree Protocol (Rapid-PVST+) • MSW1 is the STP root bridge for VLAN 10 • MSW2 is the STP root bridge for VLAN 20 This ensures predictable forwarding paths and fast convergence. HSRP Gateway Redundancy • VLAN 10 uses virtual gateway 192.168.10.1 • VLAN 20 uses virtual gateway 192.168.20.1 HSRP active routers are aligned with STP root placement to avoid suboptimal traffic paths.
EtherChannel Configuration Multiple physical links are bundled between access and distribution layers using EtherChannel: interface range g0/1 - 2 channel-group 1 mode active Benefits include increased bandwidth, link redundancy, and simplified STP topology.
DNS Integration The internal DNS server at 192.168.10.11 resolves both internal and external hostnames. Example DNS record: michaelcozier.com resolves to 173.1.1.14 Verification commands: ping michaelcozier.com nslookup michaelcozier.com
Access Control Lists (ACLs) Standard ACLs are used to restrict traffic between VLANs and protect the server network: access-list 10 permit 192.168.10.0 0.0.0.255 access-list 10 permit 192.168.20.0 0.0.0.255 access-list 10 deny any This ensures only authorized internal traffic can access server resources while blocking unwanted access attempts.
Secure Management and SSH Configuration Console and Local Access line console 0 password ccna login exec-timeout 5 0 logging synchronous SSH Remote Management hostname MSW1 ip domain-name michaelcozier.com crypto key generate rsa modulus 2048 ip ssh version 2 username mike privilege 15 secret ccna line vty 0 15 transport input ssh login local SSH access is encrypted and authenticated locally, allowing management using DNS hostnames instead of IP addresses. Test examples: ssh -l mike switch1 ssh -l mike router1
Centralized Syslog Integration A Syslog server located at 192.168.20.25 collects logs from all switches and routers. Configuration example: logging host 192.168.20.25 logging trap informational service timestamps log datetime msec service sequence-numbers This provides: • Visibility into OSPF and HSRP state changes • STP root changes and link status monitoring • Audit trails for device login attempts • Faster troubleshooting during failover events
Testing and Validation • DHCP successfully assigned IP addresses, gateways, and DNS • DNS resolution worked across VLANs and through OSPF • ACLs enforced proper segmentation • HSRP failover occurred with minimal interruption • OSPF dynamically reconverged after link failures • GRE tunnels maintained external connectivity • EtherChannel links provided fault tolerance • Syslog captured events in real time • SSH access verified using DNS-based hostnames
Why This Design Works • End-to-end redundancy eliminates single points of failure • Centralized logging improves visibility and troubleshooting • STP and HSRP alignment optimizes traffic flow • Secure management protects control and data planes • Scalable architecture supports future VLANs, sites, and tunnels
Homelab
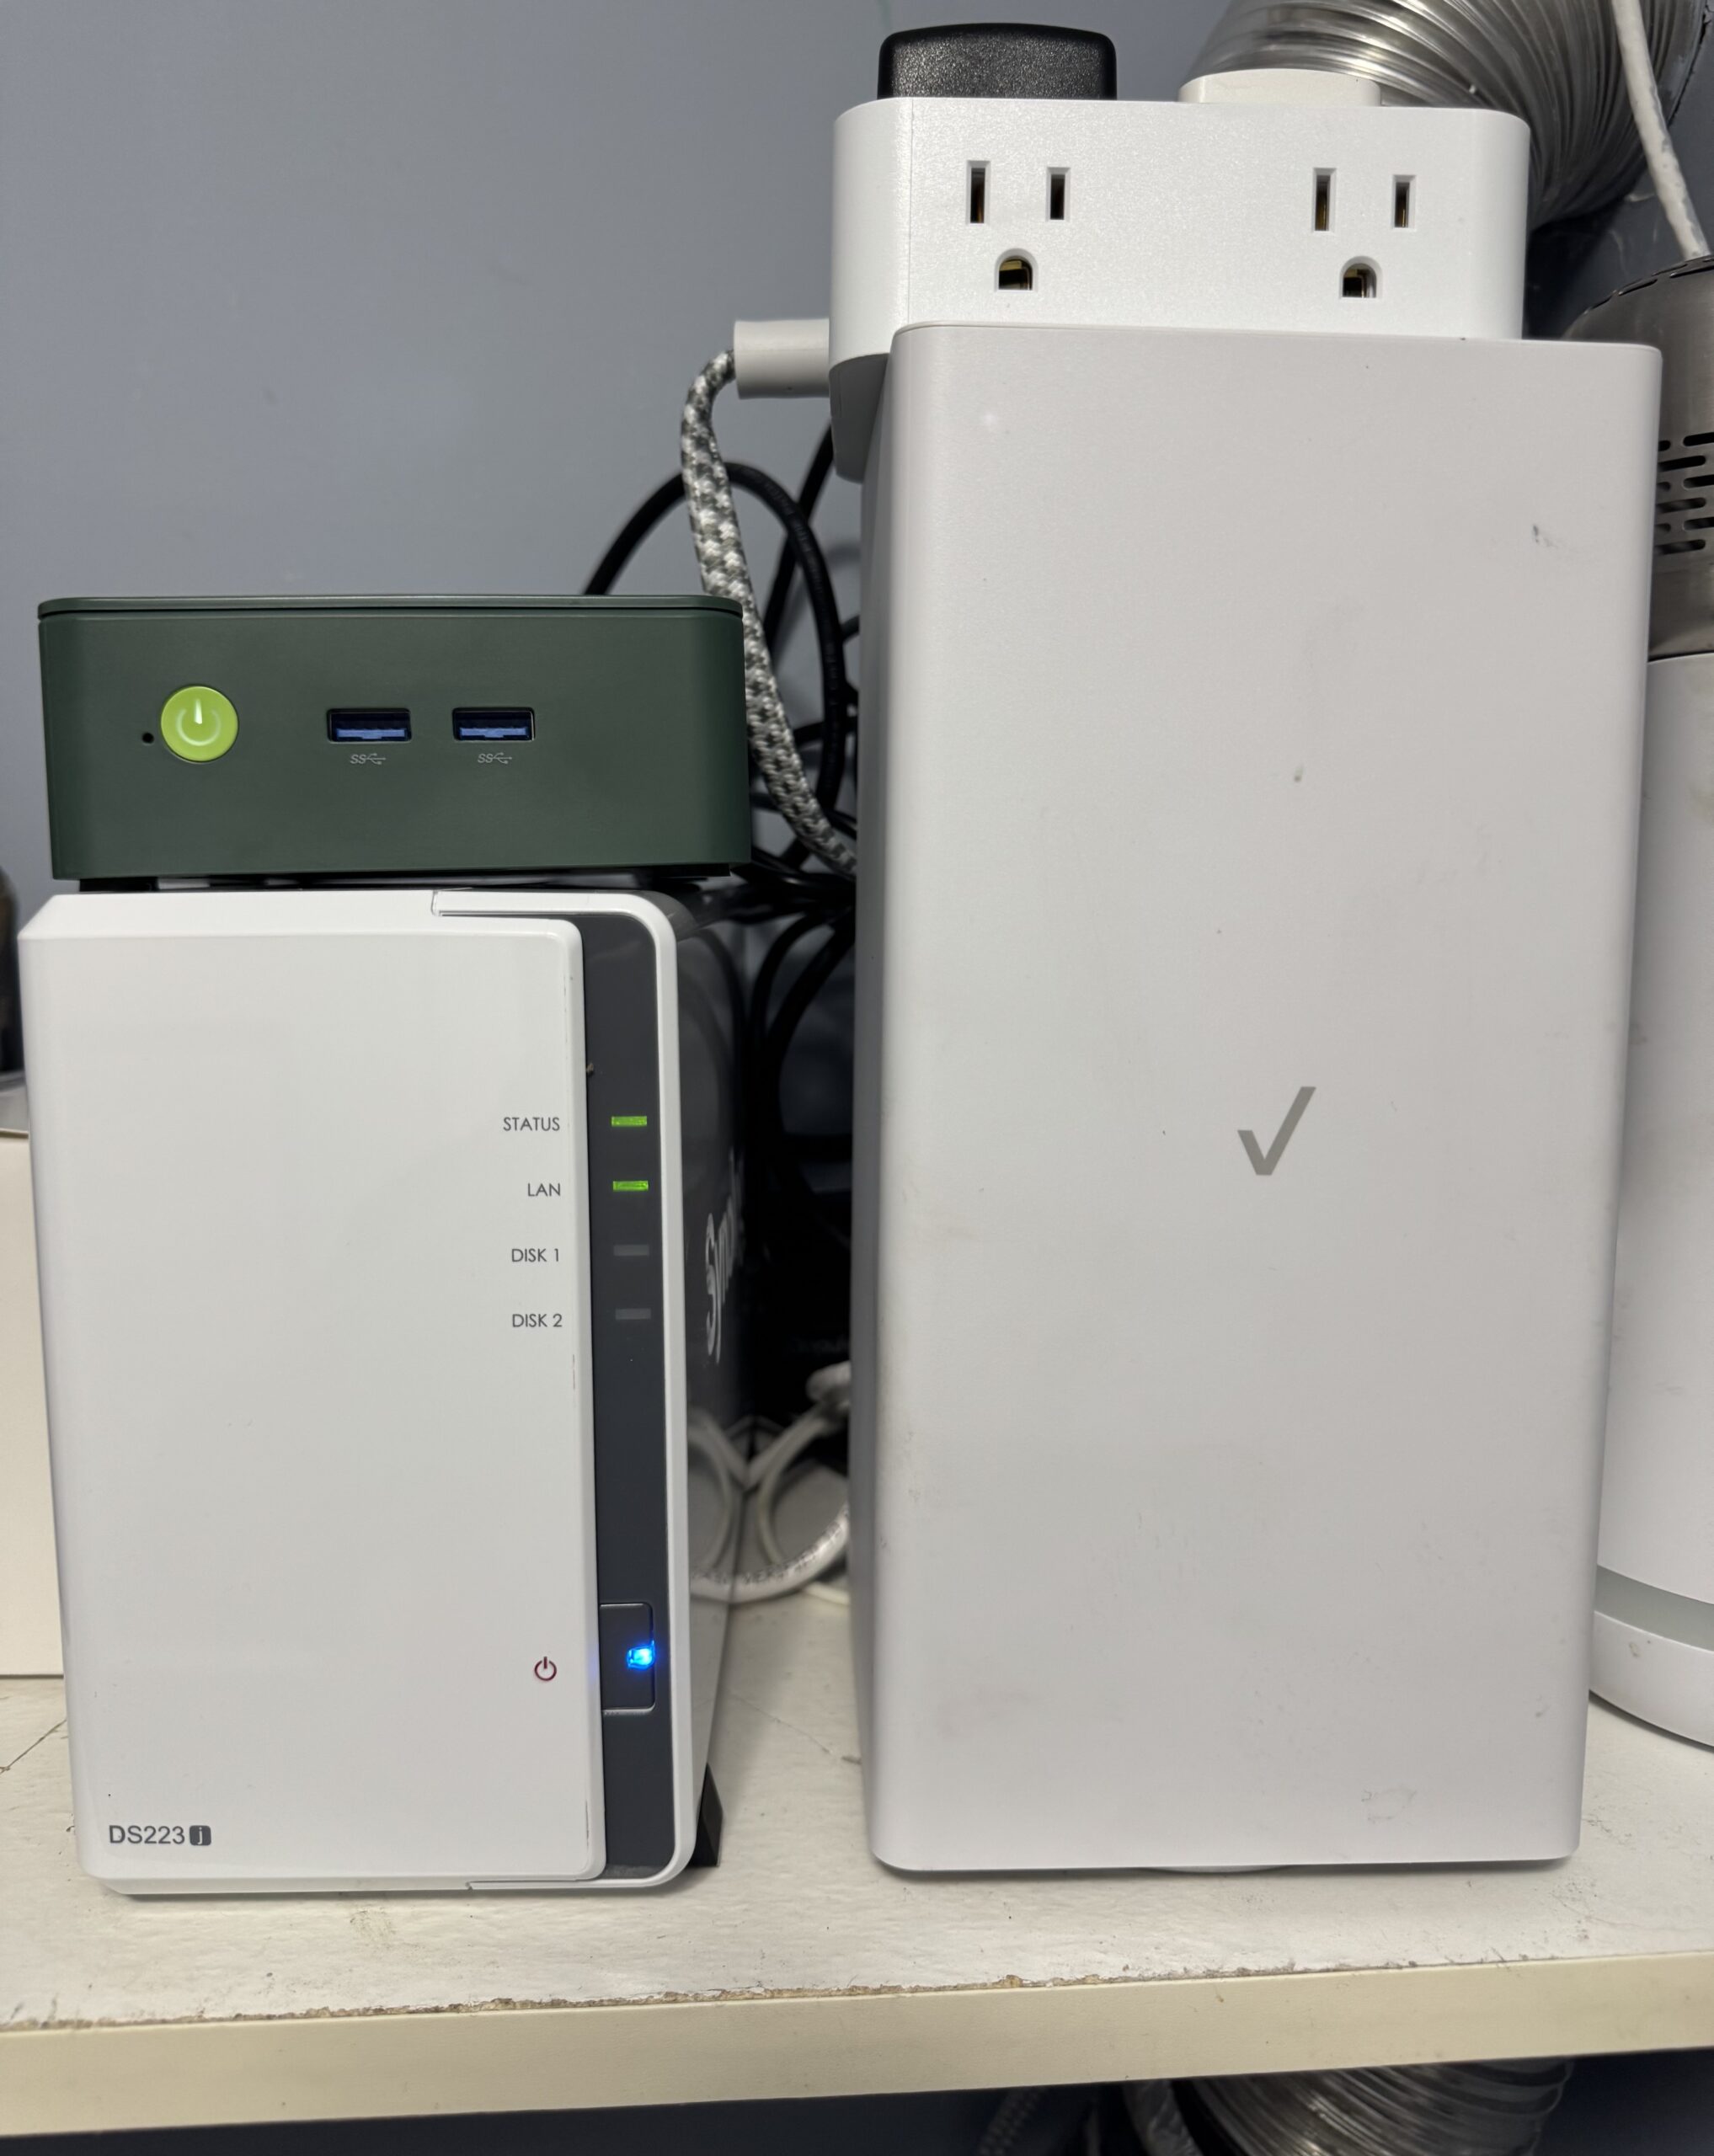
DevOps Home Lab As a retired NYPD Sergeant and U.S. Army Veteran transitioning into DevOps, I built this self-hosted, production-grade home lab to mirror real-world infrastructure. It’s designed for learning, testing, automation, and hardening — with security and observability at its core.
Hardware Setup
| Device | Purpose |
|---|---|
| Desktop | Kali Linux + Windows 11 (dual boot) for local dev/testing |
| Laptop | Kali Linux for mobility and SSH access |
| Server | GMKtec N100 running Ubuntu Server |
| Hypervisor | MinisForum MS-01 with Proxmox VE |
| NAS | Synology DS223j (16TB) for media & backups |
Core Dockerized Services
- Traefik – Reverse proxy with auto HTTPS (Let’s Encrypt)
- Pi-hole – Network-wide ad/malware blocking
- Prometheus + Grafana – Metric collection and dashboards
- Plex – Media server integrated with NAS
- Nginx – Static site hosting (including this website)
- Radarr – Automated movie management and downloads
- Sonarr – Automated TV series management and downloads
- Jackett – Indexer aggregator for Radarr/Sonarr integrations
- Homepage – Custom dashboard for quick access to homelab services
- HashiCorp Vault – Issues short-lived SSH certificates for secure, just-in-time server access
Networking & Access
- TLS encryption for all services (Let’s Encrypt via Traefik)
- Subdomain routing handled via Cloudflare
- SSH access restricted to public key authentication and Vault-issued certificates
- Dynamic DNS managed through Cloudflare API
- Reverse proxy + firewall rules for tight access control
Monitoring & Automation
- Prometheus – Time-series metrics
- Grafana – Visual dashboards (disk, CPU, containers)
- Fail2Ban – SSH brute-force protection
- Bash scripts – Automated daily health reports via email (cron)
Design Principles
- Security-first – Vault-based SSH certificates, public key SSH, HTTPS, restricted ports
- Separation of concerns – Media, DNS, compute split by service
- Production-like – Infrastructure mimics real environments
- Self-hosted – Full control, no third-party lock-in
- Flexible + Scalable – Proxmox allows isolated VM environments for experimentation
This lab gives me hands-on experience with the same tools used in real-world DevOps — and helps me continuously improve my automation, observability, and security skills.
🔗 Back to Projects | View on GitHub